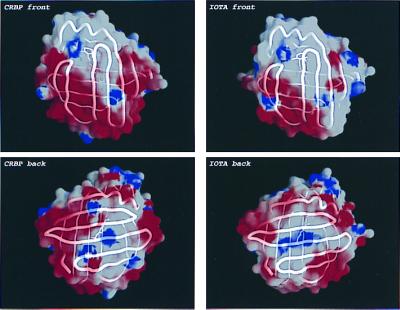
Figure 3.

Reduced surface charge of ι-crystallin (Right) as compared with rat CRBP I (Left). (Upper) Front view. (Lower) Back view. Molecular surfaces, calculated in grasp (15), are colored according to electrostatic potential: red < −5.0 kT and blue > 5 kT. The Cα backbone worm is shown in white, and retinoids are in a stick representation (3,4-didehydroretinol for ι-crystallin and retinol for CRBP I).
