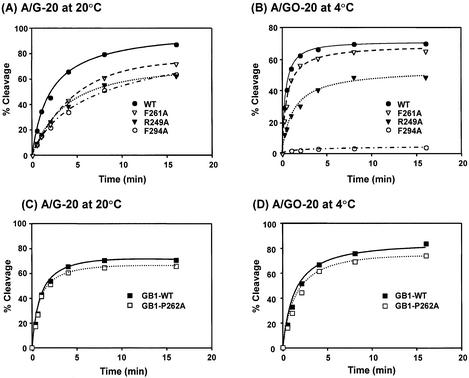
Figure 4.
Time course studies of glycosylase activities of the wild-type and mutant MutY proteins. (A) and (C), A/G-containing DNA (1.8 fmol) was incubated with 3.6 nM proteins in a 10 µl reaction at 20°C. (B) and (D), A/GO-containing DNA (1.8 fmol) was incubated with 0.45 nM proteins in a 10 µl reaction at 4°C. After reaction, the products were treated with 0.1 M NaOH as described in Materials and Methods and analyzed on a 14% denaturing sequencing gel. Data were from PhosphorImager quantitative analyses of gel images over three experiments. Percentages of DNA cleaved were plotted as a function of time. Wild-type MutY (WT, solid circle), F261A (open triangle), R249A-MutY (solid triangle), F294A-MutY (open circle), GB-tagged MutY, (GB1-WT, solid rectangle), and GB-F261A-MutY (open rectangle).

