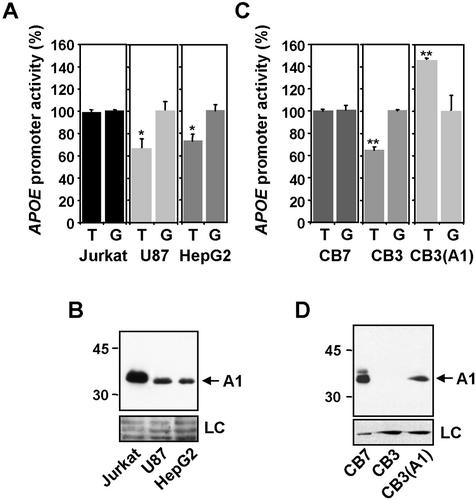
Figure 4.
Effect of A1 in the relative APOE promoter activity of the two –219 allelic forms. (A and C) Comparative analysis of the basal activity of the two –219 allelic forms of APOE promoter in different cell lines. CB3(A1) is the cell line CB3 stably transfected with A1. (B and D) Western blot analysis using an anti-A1 antibody of the expression of this protein in the different cell lines. Loading controls (LC) for equal protein amounts were performed by Ponceau S staining of the blot (B) and by immunostaining with anti-tubulin antibody (D). Data are representative of at least three independent experiments, performed in triplicate, and are expressed as mean ± SEM. Differences between the activity of –219T and G forms were analyzed by Student’s t-test. (* p < 0.04, ** p ≤ 0.01).

