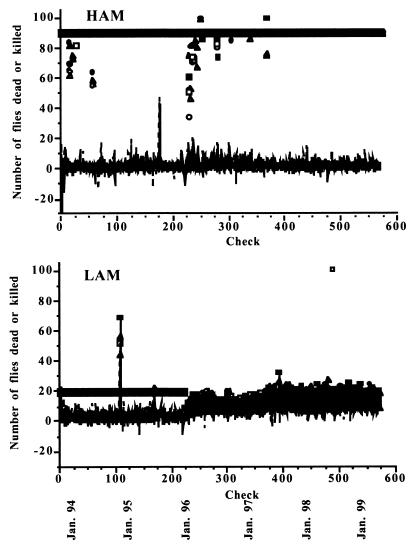
Figure 1.
Intrinsic and total mortality in the population cages. Intrinsic mortality is indicated by the irregular lower lines, one line per replicate. Negative mortalities indicate that too many flies accidentally were added in the last check. Total mortality (intrinsic plus extrinsic mortality) is given by the thick straight line. The symbols indicate when there were not enough flies available to achieve the target mortality because not enough eggs had been laid 14 days previously. □, Replicate 1; ○, replicate 2; ▵, replicate 3. Filled symbols indicate females, and open symbols indicate males. (Upper) HAM. The symbols above the total-mortality line indicate that 4 times a replicate was lost because of mislabeling and was replaced from backup stocks 2 weeks behind the current history of selection. At the start of the experiment and after larval density was increased in January 1996, there were sometimes not enough replacement flies to achieve the target mortality (23 times for females, 2.1% of the checks; 20 times for males, 1.8% of the checks). (Lower) LAM. Before January 1996, natural mortality rates twice exceeded 20%. After January 1996, when the target mortality was 10%, there were more old flies in the cages, and intrinsic mortality increased. From January 1996 to July 1998, intrinsic mortality was 11.3% for females (vs. 2.8% in HAM) and 10.3% for males (vs. 3.6% in HAM).

