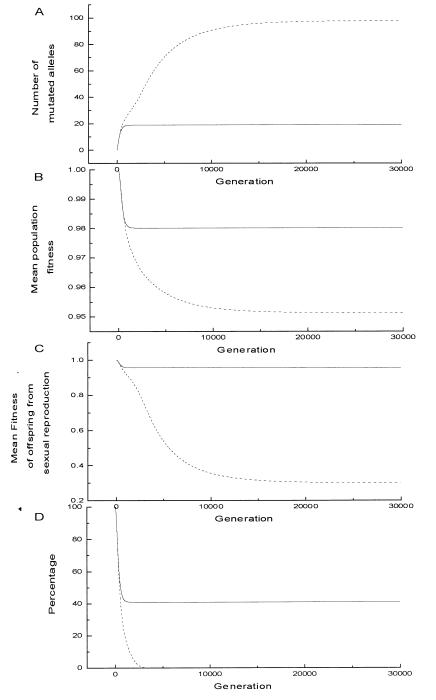
Figure 4.
The results of the deterministic model (ps = 0.025, μ = 0.05, s = 0.05, N = 100, AL = 50). The dashed lines stand for the species without cell senescence; solid lines stand for the species that employs cell senescence. (A) Average number of deleterious mutations per diploid genome. (B) Mean population fitness. (C) Mean fitness of the offspring from sexual reproduction. (D) Percentage that offspring from sexual reproduction that have above-average fitness.

