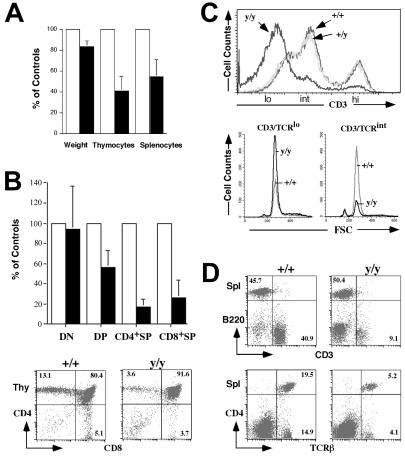
Figure 2.
Abnormal T lymphocyte development in Atmy/y mice. (A) Average pairwise comparisons of weight, total numbers of thymocytes, and splenocytes from 10 same-sex littermates pairs 1–5 mo old. (B) (Upper) The average reduction of the total number of each Atmy/y thymocyte subpopulations (DN, CD4−8−; DP; CD4+8+; CD4+SP, CD4+8−; CD8+SP, CD4−8+) from seven littermate pairs. (Lower) FACS analysis of T cell development in Atmy/y thymuses. (C) Histogram of CD3 surface expression in Atmy/y thymocytes (y/y). (Lower) FSC (forward site scatter) using a lymphocyte gate on CD3low and CD3int DP cells, respectively. (D) Splenic T cells in Atmy/y mice (y/y) were reduced in numbers, but their surface phenotype (TCRβ/CD3 expression) appeared to be normal. Numbers indicate the percentage of splenic T cells (CD3+) and B cells (B220+).

