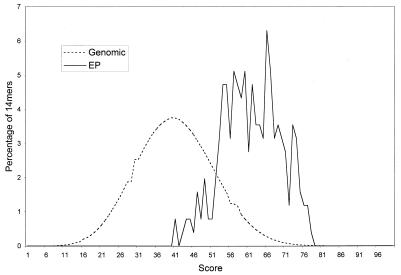
Figure 4.
Comparison of how well 14-mer from EP insertion sites (solid line) and 14-mer from genomic sequences (dotted line) fit the 14-bp pattern. A score for each 14-mer is calculated by using the function described in Materials and Methods. The results are then plotted as percentage of 14-mer at each score. 91.7% of 14-mer from EP insertion sites are outside the first standard deviation of the distribution of 14-mer from unselected genomic sequences, and 87.7% of 14-mer from unselected genomic sequences are outside the first standard deviations of the distribution of 14-mer from EP insertions.

