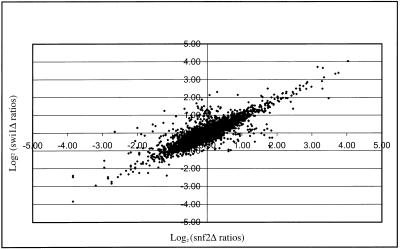
Figure 1.
Scatter plot of expression ratios of all genes in snf2Δ and swi1Δ in rich medium. The ratio of mutant to wild-type mRNA levels was calculated for every gene in both mutants. Only genes with at least 40 fluorescence units in the wild type were included. The ratios were transformed to Log2 (ratio), such that a two-fold increase in gene expression in a mutant would equal 1 whereas a two-fold decrease would equal −1. To compare the expression of each gene in snf2Δ to that in swi1Δ, the transformed ratios for every gene in snf2Δ was plotted against those in swi1Δ.

