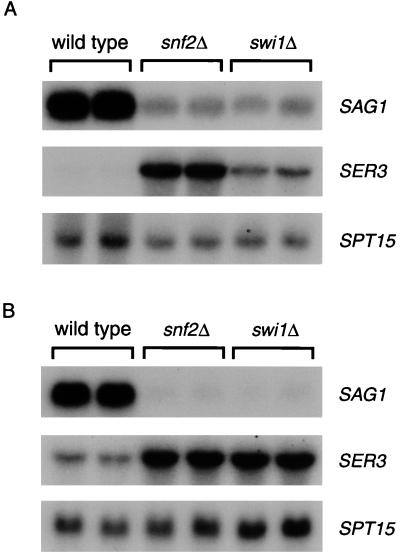
Figure 2.
Opposite effects of snf/swi mutations on mRNA levels. Northern blot analysis of SAG1 and SER3 mRNA levels in the strains FY2, FY20, FY31, FY32, FY1254, and FY1882 grown in rich medium (A) or minimal medium (B). mRNA levels of each pair of strains were averaged before normalization to the wild type. SAG1 mRNA levels are 0.13 and 0.04 in rich and minimal media, respectively, in snf2Δ and 0.11 and 0.03 in rich and minimal media, respectively, in swi1Δ, compared with the wild-type strain (1.0). SER3 mRNA levels are 21.4 and 3.19 in rich and minimal media, respectively, in snf2Δ and 6.94 and 2.36 in rich and minimal media, respectively, in swi1Δ compared with the wild-type strain (1.0).

