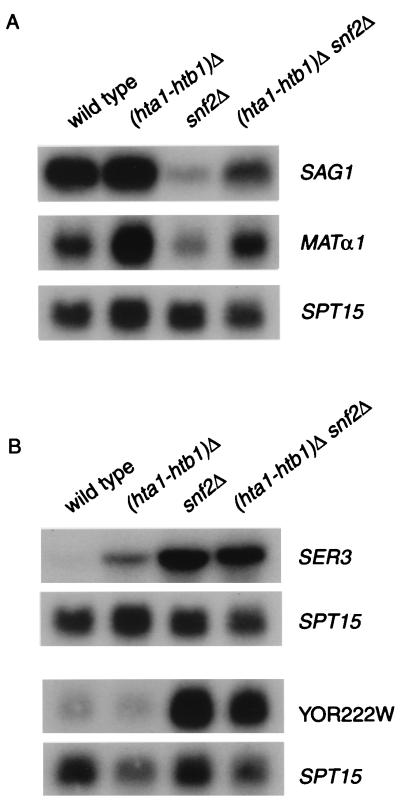
Figure 4.
The decreased mRNA levels of SAG1 and MATα1 in snf2Δ mutants are suppressed by (hta1-htb1)Δ, but the increased mRNA levels of SER3 and YOR222W are not suppressed. (A) Northern blot analysis of SAG1, MATα1, and SER3 was performed on RNA prepared from strains FY2, FY1884, FY31, and FY1885. SAG1 mRNA levels in (hta1-htb1)Δ, snf2Δ, and (hta1-htb1)Δ snf2Δ are 0.82, 0.15, and 0.51, respectively. MATα1 mRNA levels are 1.51, 0.39, and 1.20, respectively. (B) Analysis of YOR222W mRNA levels was done on strains FY57, FY710, FY458, and FY724. SER3 mRNA levels in (hta1-htb1)Δ, snf2Δ, and (hta1-htb1)Δ snf2Δ are 5.28, 23.2, and 25.1, respectively. YOR222W mRNA levels are 1.79, 7.95, and 7.99, respectively. All mRNA levels are relative to those in the wild-type strain (1.0). All strains were grown in rich medium.

