


Figure 3.
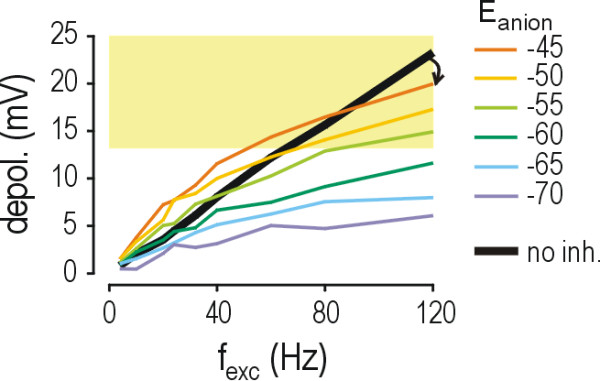
Shunting has a much greater impact on depolarization than it does on firing rate. These data are based on simulations in the model neuron with Hodgkin-Huxley (HH) channels removed so as to prevent spiking and thereby allow measurement of the underlying depolarization. Yellow shading shows suprathreshold voltages. α = 1. Unlike the nearly linear fout-fexc curves seen in Figure 2, the depol-fexc curves with inhibition (colored) are clearly sublinear (i.e. bend downwards). This sublinearity is not seen in the depol-fexc curve without inhibition (black). At low fexc, depolarization is paradoxically enhanced by inhibitory input with Eanion = -50 and -45 mV (i.e. the yellow and orange curves lie above the black curve on the left side of the graph) but, because of the sublinearity in those curves, at high fexc, depolarization is reduced by inhibitory input (i.e. the yellow and orange curves lie below the black curve on the right side of the graph; arrow) even if that reduction is less than that for inhibition with Eanion = -70 mV.