Figure 3.

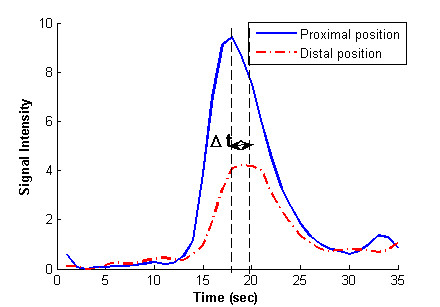
Bolus time density curve at proximal (solid) and distal (dash dot) positions of aorta in ROI. It is used to compute the peak-to-peak transit time Δt.

Bolus time density curve at proximal (solid) and distal (dash dot) positions of aorta in ROI. It is used to compute the peak-to-peak transit time Δt.