
Figure 2.
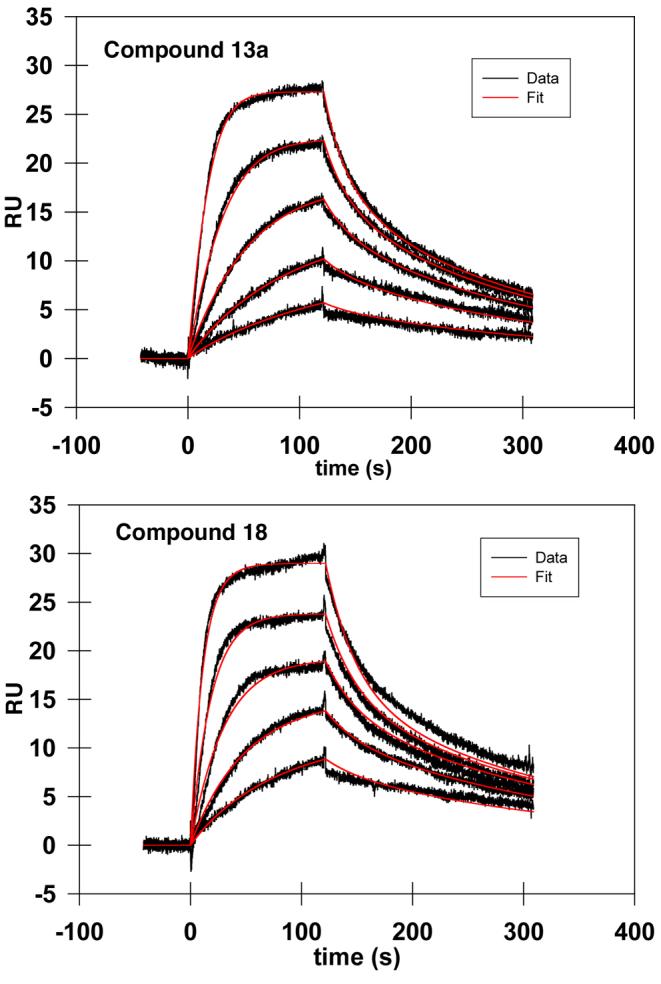
Representative SPR data for 13a and 18 (panel B) showing response in RU units versus time. Traces in black are for two-fold dilutions of inhibitor from 62 nM to 0.98 nM. Curve fitting for two-component models are shown in red.
Official websites use .gov
A
.gov website belongs to an official
government organization in the United States.
Secure .gov websites use HTTPS
A lock (
) or https:// means you've safely
connected to the .gov website. Share sensitive
information only on official, secure websites.
Representative SPR data for 13a and 18 (panel B) showing response in RU units versus time. Traces in black are for two-fold dilutions of inhibitor from 62 nM to 0.98 nM. Curve fitting for two-component models are shown in red.