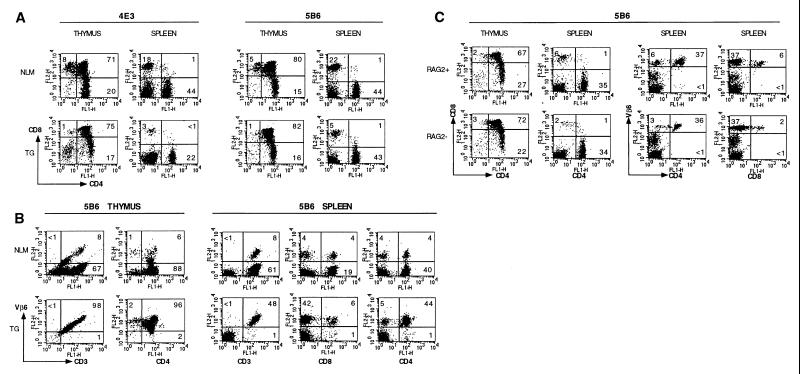
Figure 3.
Flow cytometry analysis of thymocytes and peripheral T cells in TCR-transgenic mice. T cells from thymi and spleens of 6- to 8-week-old TCR transgenic 4E3 (line 1740, A), 5B6 (line 1858, A/B), and 5B6 RAG-2-deficient mice (line 1858, C) were stained with indicated antibodies (FITC- or PE-conjugated anti-CD4, FITC- or phycoerythrin-conjugated anti-CD8, PE-conjugated anti-Vβ6, FITC-conjugated anti-CD3). Dot plots representing two-color FACS analysis of TCR transgenic (TG) with or without RAG-2 deficiency (TG/RAG2−, TG/RAG2+) and nontransgenic littermates (NLM) are shown. Numbers in quadrants refer to percentages of gated cell populations.

