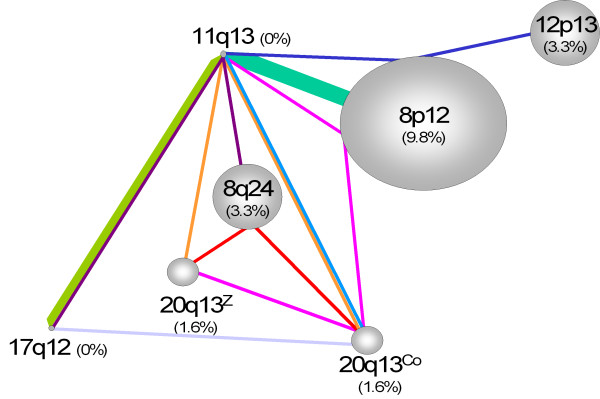
Figure 2.

Co-amplification network. Schematic representation of frequencies of single amplifications and co-amplifications in 128 breast tumors samples. The size of spheres represents the frequency of region amplified as single. Lines of the same color represent co-amplification and the thickness of lines represents the frequency of the co-amplification: small: 1.6%, medium: 3.3%, large: 8.2%. For instance, the pink line linking 11q13, 8p12, 20q13Co and 20q13Z represents a co-amplification of all these regions found in 1.6% of informative cases (N = 128).
