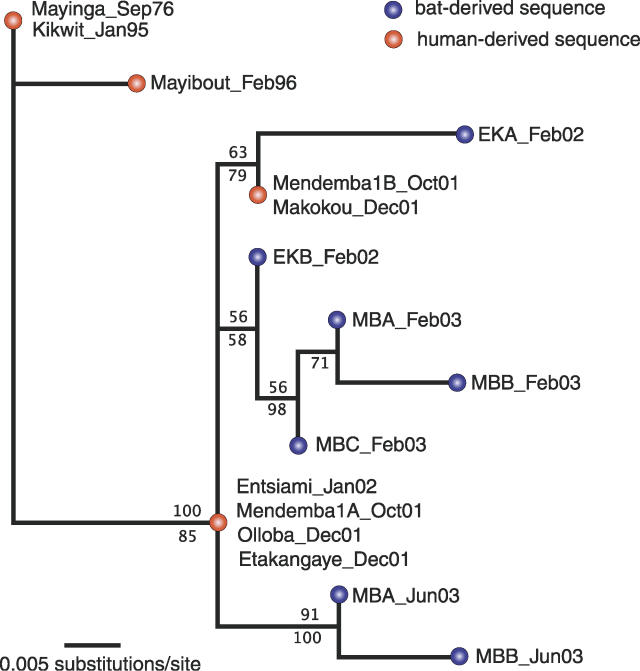
Figure 1. Maximum Likelihood Tree from Partial L Sequences of Ebola Virus Zaire.
Tree was obtained in PAUP* 4.0b10.8 [7] under a HKY + I model. Values above branches represent percent support based on 1,000 maximum likelihood bootstrap trees; values below branches represent posterior probabilities from a complementary Bayesian analysis in BEAST [8]. For details regarding methods (including tree rooting), see Walsh et al. [4]. Year and month of sampling is given for each sequence.

