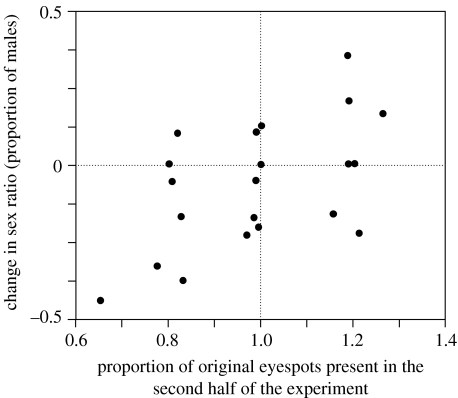
Figure 1.
Proportion of eyespots in the first half of the experiment that were present in the second half in relation to changes in the sex ratio of offspring he sired. The three clusterings of data points represent the three groups, A (right), B (centre) and C (left). Each data point represents one pen (n=21).

