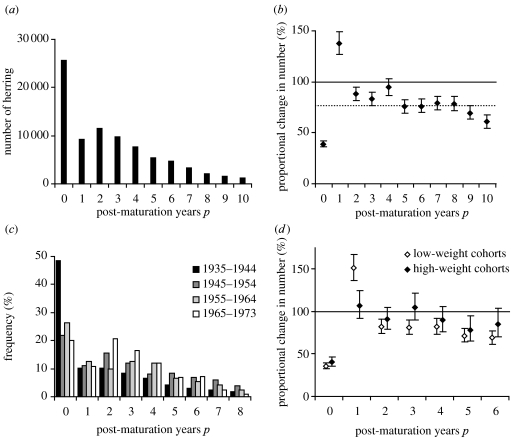
Figure 1.
(a) Total numbers of herring sampled in the spawning area during 1935–1973 at different numbers of post-maturation years. First-time spawners have zero post-maturation years. (b) Proportional change (with s.e.) in numbers of herring, present in the spawning area, from p to p+1 post-maturation years (estimated with model (2.1)). Dotted line indicates mean annual survival, estimated with model (2.2). (c) Frequency distributions of herring with different numbers of post-maturation years by decade. (d) Proportional change (with s.e.) in numbers of herring, present in the spawning area, from p to p+1 post-maturation years (estimated with model (2.1)), shown separately for year-classes with lower- or higher-than-average mean weight as first-time spawners (overall mean, 213 g).

