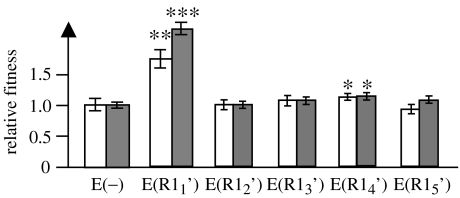
Figure 1.
Relative fitness of E. coli bearing evolved R1 plasmids, R11′ to R15′ from five independent experiments with the fitness of E(−) normalized to one. E(R1) and E(−) stand for E. coli K12 cells bearing and not bearing the R1 plasmid, respectively. White bars show relative fitness measured by competition against E. coli srl∷Tn10, StrR (R1); grey bars show competition against E. coli K12 Δara, ValR (R1). Fitness values (±twofold the standard error, both throughout the text and in error bars) are relative to E(−), which is 1±0.077 for the white bar (n=15, n being the number of experiments) and 1.000±0.033 for the grey bar (n=15). Relative fitnesses of E(R11′)–E(R15′) are, respectively, 1.726±0.192 (n=15), 1.026±0.074 (n=3), 1.101±0.072 (n=3), 1.162±0.021 (n=3) and 0.951±0.067 (n=3) for white bars and 2.051±0.087 (n=12), 1.013±0.071 (n=3), 1.088±0.050 (n=3), 1.128±0.042 (n=3) and 1.092±0.053 (n=3) for grey bars. Significance levels over the bars (two-tailed t-test assuming unequal variances: *if p<0.05, **if p<0.01 and ***if p<0.001) refer to significant differences of fitness relative to E(−)).

