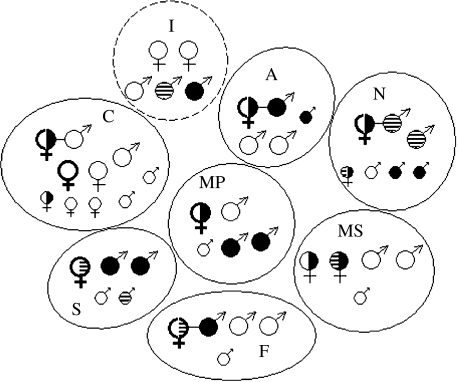
Figure 1.
Distribution of opsin genotypes among eight tamarin groups. Black, 543 nm opsin allele; stripes, 556 nm allele; white, 563 nm allele. Large circles, adults; small circles, infants, juveniles and subadults. Identified breeding pairs are shown joined by a line and females that were confirmed breeders during the study are shown with thick lines. Group ranges are shown in approximate geographic position. Group I (dotted line) was unstable over the course of the study. Since the individuals shown were not all present at the same time, and several adults were not captured, this group was excluded from randomization analyses.

