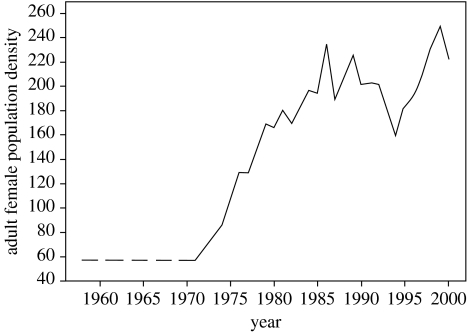
Figure 1.
Line plot showing the female population density (number of resident females observed in more than 10% of January to May censuses of the study area over 1 year of age), an indicator of environmental quality in the study area, over time. Females born before regular censusing began were assumed to have experienced densities equal to those in 1971 (dashed line).

