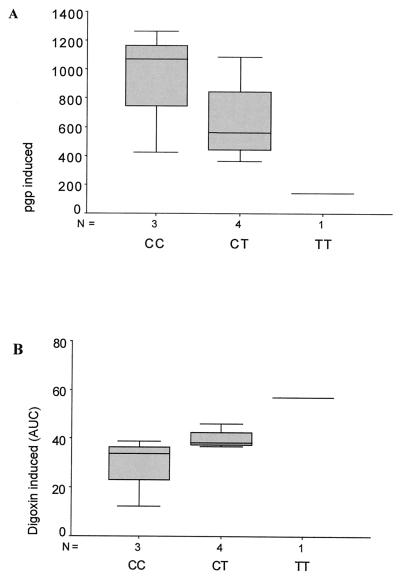
Figure 4.
MDR-1 expression and PGP in vivo activity after rifampin induction. MDR-1 genotype in exon 26 and distribution of rifampin-induced PGP protein expression (A) in the duodenum. (B) Distribution of plasma levels of digoxin after rifampin induction. The plasma levels of digoxin area under the curve, μg × h × L−1 (AUC) are inversely proportional to PGP activity in the duodenum (9). The correlation of MDR genotype and PGP activity has a significance of P = 0.053 (n = 8).

