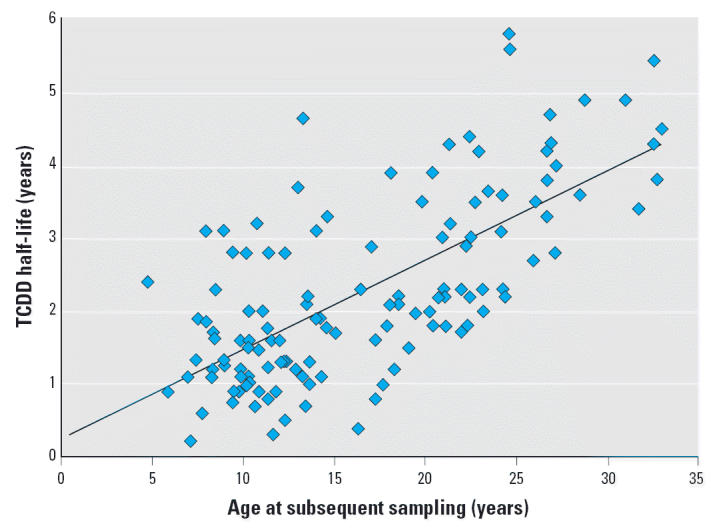
Figure 2.

TCDD half-life versus age of Seveso children. Linear regression analysis of entire cohort (25 females, 20 males) with the half-life since peak TCDD measurement plotted against the person’s age at time of subsequent sampling. See “Materials and Methods” for outliers identified and excluded. See also Table 1.
