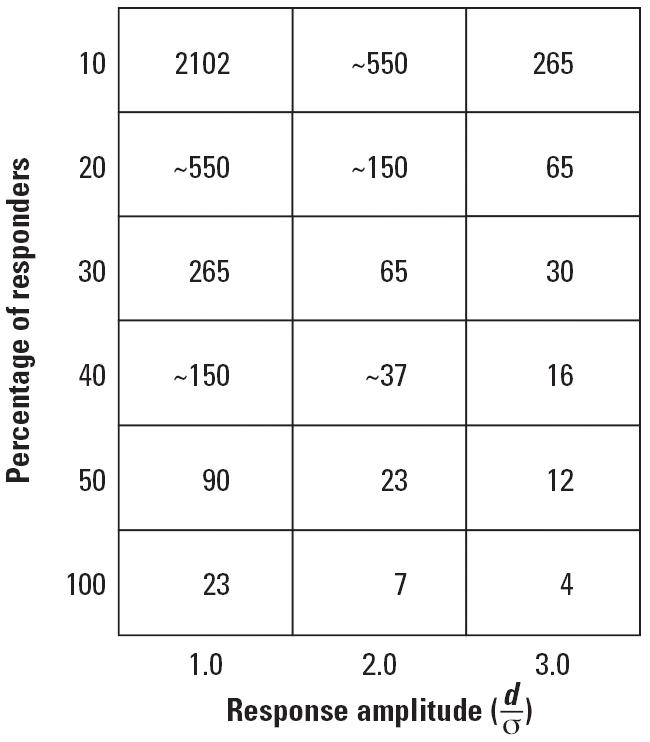
Figure 3.

Sample size required to demonstrate a statistically significant effect (p = 0.01) 90% of the time for different magnitudes of response (effect size) and different proportions contributed by sensitive subpopulations. The ability to detect a small overall change when only a small proportion of the total population consists of responders requires extremely large sample sizes.
