
Fig. (7).
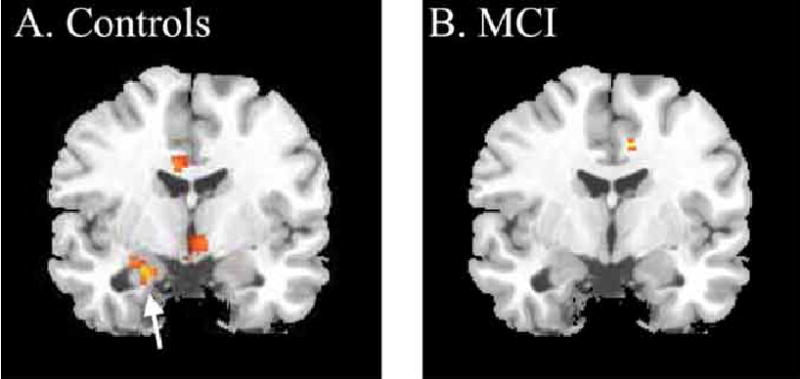
Statistical parametric maps of adaptation during the Choose task in 13 controls and 8 MCI. The activations can be interpreted as regions where the negative slope of change over repeated trials is significantly different from zero. (A) The average slope of adaption in the controls is significant in the anterior medial temporal lobe at the point where the hippocampus and amygdala conjoin (t=4.38, p<.001; x,y,z -22, -4, -22). (B). The MCI patients do not exhibit any significant change over trials in the MTL. The group statistics in A and B are superimposed on the same standard atlas brain at the same slice location. The left side of the brain is on the left side of the image.