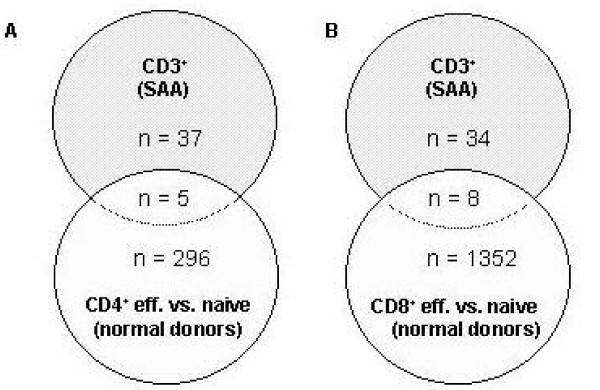
Figure 2.

Gene expression profile analysis of normal T-cell subpopulations in comparison to differentially expressed genes in CD3+ T-cells of SAA patients. The gene expression data of effector memory T-cell populations were compared separately for each of 3 normal donors with the mean gene expression level of the respective naive T-cell populations [13, 14]. Significantly regulated genes (p < 0.05, student's t-test) were further analyzed in comparison to the differential gene expression pattern of SAA patients (pool I and pool IIa of the PB). Number of commonly and differentially expressed genes is shown for effector memory versus naïve CD4+ T-cells in comparison to circulating CD3+ T-cells of SAA patients (part A) and also for the respective CD8+ T-cell subpopulations (part B).
