
Figure 5.
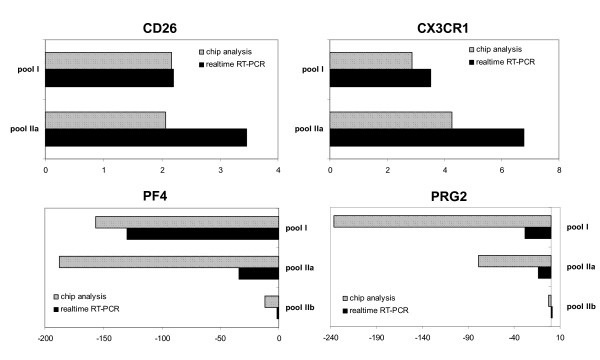
Validation of microarray results by real-time PCR. Selected genes (CXCL4, PRG2, CD26, CX3CR1) with differential gene expression in the analyzed SAA and control pools were quantified by Taqman RT-PCR in 2 independent experiments. Relative mRNA expression levels were normalized with respect to RPS9 gene expression as internal control. Results are shown as mean fold-change value of the respective gene expression in the control pool. Slanted bars: Microarray result; black bar: respective real-time RT-PCR result. Panel A shows upregulated genes. Panel B demonstrates downregulated genes.