
Figure 2.
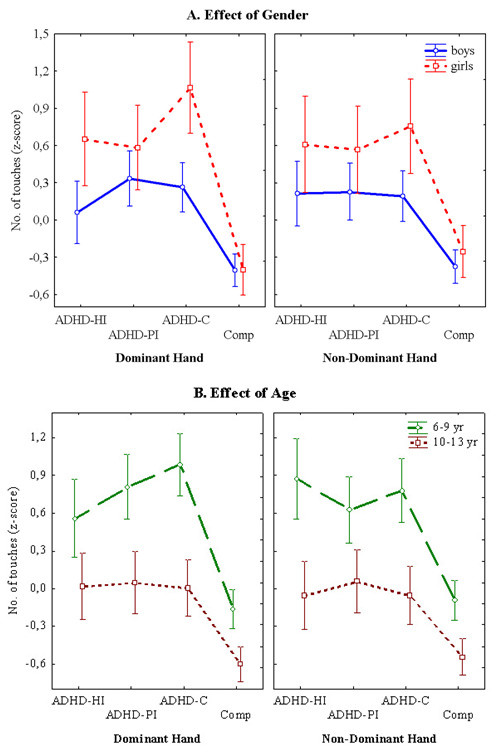
Maze Coordination Task. A. The graph shows the means ± SEM of number of touches against the sides of the maze made by the groups with symptoms of the three ADHD subtypes and the non-ADHD comparison group as a function of gender. The left side graph shows the performance with the dominant hand, while the right side graph shows the number of touches with the non-dominant hand. B. The graph shows the means ± SEM of the number of touches against the sides of the maze made by the groups with symptoms of the three ADHD subtypes and the non-ADHD comparison group as a function of age. The left side graph shows the performance with the dominant hand, while the right side graph shows the results with the non-dominant hand.