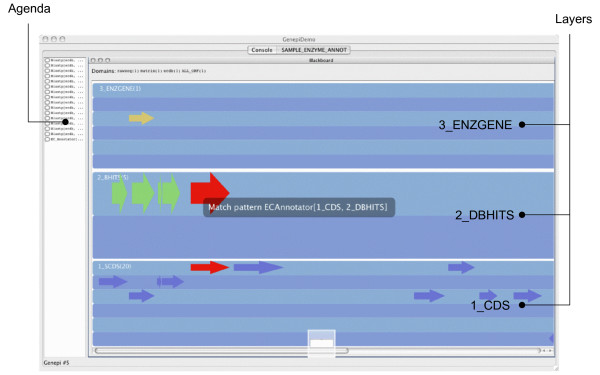
Figure 7.
Execution of the blackboard implemented in Figure 6. This figure shows the Genepi graphical interface during the execution of the blackboard declared in 6. The left panel displays the contents of the agenda with several applicable KS's currently waiting for execution. The central (blue) panel displays the three layers containing genomic features. When this screenshot was taken, the system was matching the ECAnnotator activation pattern. This pattern requires one CDS and one DBHITS with a "during" relation (see Figure 6). The interface displays the activation pattern (black box in the center) and the corresponding objects (red color). After the ECAnnotator KS has been triggered, a new ENZGENE object may appear on the top layer.

