
Supplementary Fig. S1.
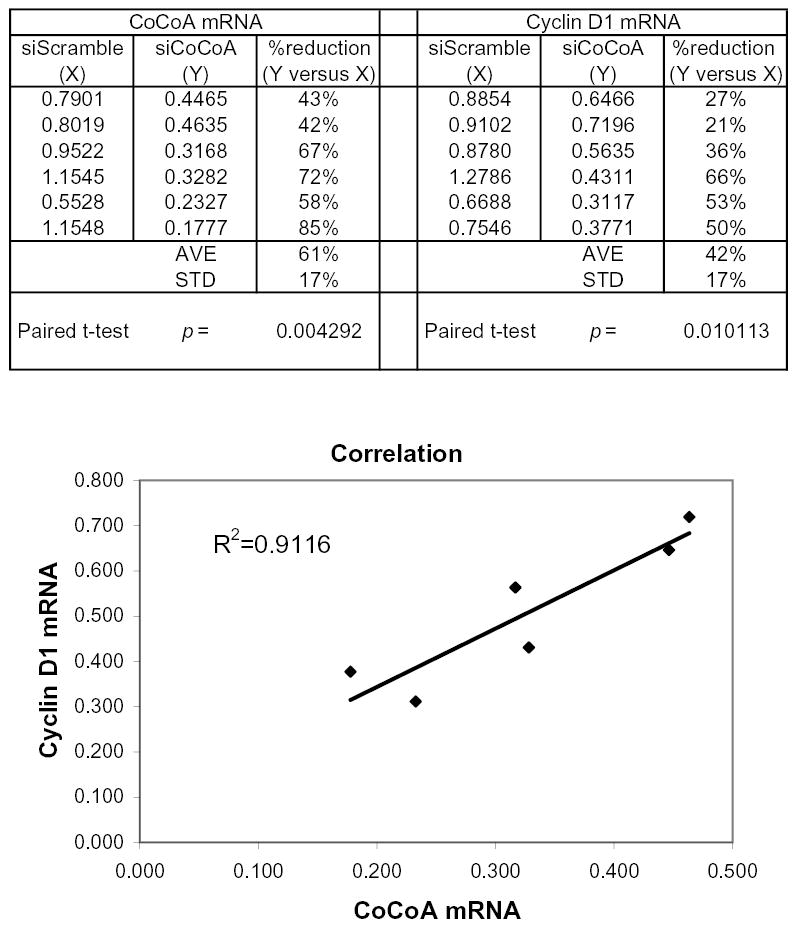
Statistical analysis of endogenous CoCoA and Cyclin D1 mRNA levels. SW480 cells were transfected with 60 pmole of either siRNA targeting CoCoA or siRNA with scrambled sequence. Total RNA was collected and cDNA was produced for quantitative real-time PCR analysis. Each number shown in columns X and Y for the CoCoA or Cyclin D1 mRNA level represents the mean from 4 QPCR reactions, which was then normalized in two steps: first, to the GAPDH mRNA level determined from the same cDNA sample; and second, to the control level of CoCoA or Cyclin D1 mRNA, respectively, determined for the cells (from the same experiment) which were not treated with siRNA. In other words, if the control CoCoA or Cyclin D1 mRNA level (in the absence of any transfected siRNA) in each experiment is set equal to 1.0, then the numbers in columns X and Y represent the relative levels to which CoCoA and Cyclin D1 mRNA were reduced by the transfection with scrambled (X) or specific (Y) siRNAs. For the 6 independent experiments shown, comparison of cells treated with siCoCoA versus scrambled siRNA by a paired, two-tailed T-test yielded the following p values: p = 0.004 for CoCoA mRNA and p = 0.01 for Cyclin D1 mRNA. The accompanying figure shows the Y value for Cyclin D1 mRNA plotted against the Y value for CoCoA mRNA for each of the 6 experiments. The Correlation Coefficient R2 for the resulting plot is 0.91, indicating a strong correlation between the CoCoA mRNA level and the Cyclin D1 mRNA level. I.e., the siRNA against CoCoA caused proportionate decreases in the levels of both CoCoA mRNA and Cyclin D1 mRNA.