Figure 4.
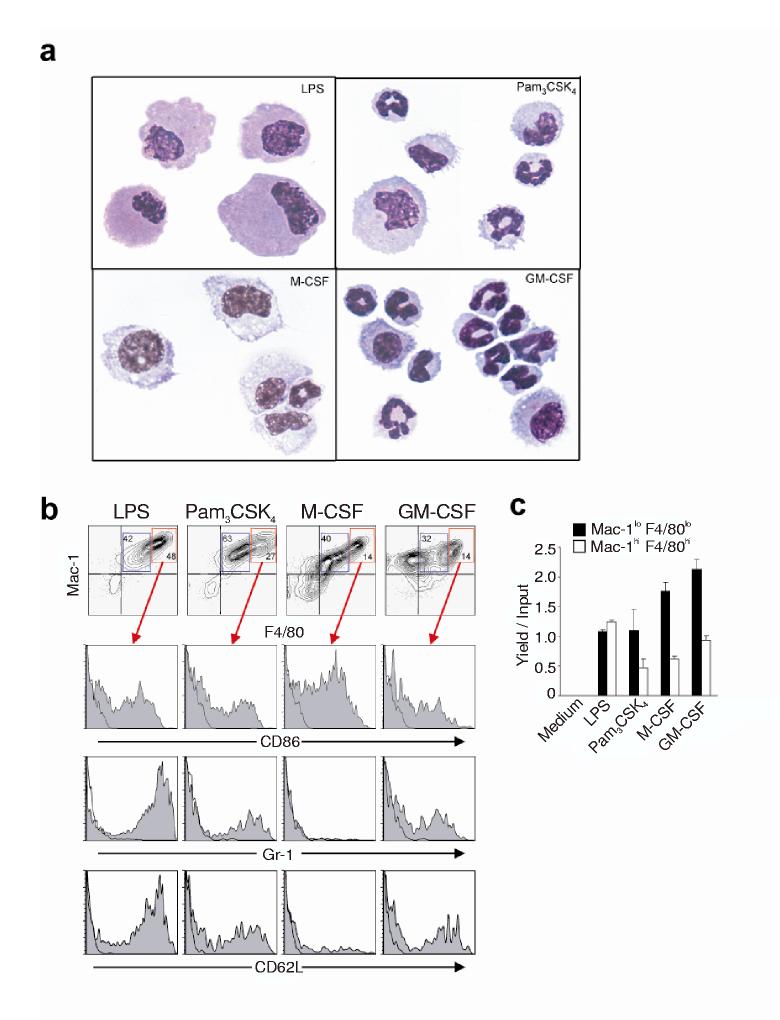
TLR stimulation drives differentiation of GMPs into F4/80hi monocytes and/or macrophages.(A) These photomicrographs were prepared with Giemsa-May-Grünwald stained cytocentrifuged slides. (B, C) Sorted GMPs were stimulated with LPS (1 μg/ml), Pam3CSK4 (100 ng/ml), M-CSF, or GM-CSF. After 72 hr in culture, cells were analyzed by flow cytometry for expression of F4/80 and Mac-1. Percentages indicate the frequencies of Mac-1lo F4/80lo or Mac-1hi F4/80hi cells. CD86, Gr-1, or CD62L were analyzed by flow cytometry on Mac-1hi F4/80hi cells. Open histograms depict staining with the appropriate isotype matched Abs. The results are representative of those obtained in two independent experiments. (C) The bar graphs depict cell yields of Mac-1lo F4/80lo or Mac-1hi F4/80hi cells. The data represent mean values with standard deviations from triplicate cultures and are representative of three independent experiments.

