
FIGURE 1. Fusion of YFP to CD80 does not alter its function or membrane mobility.
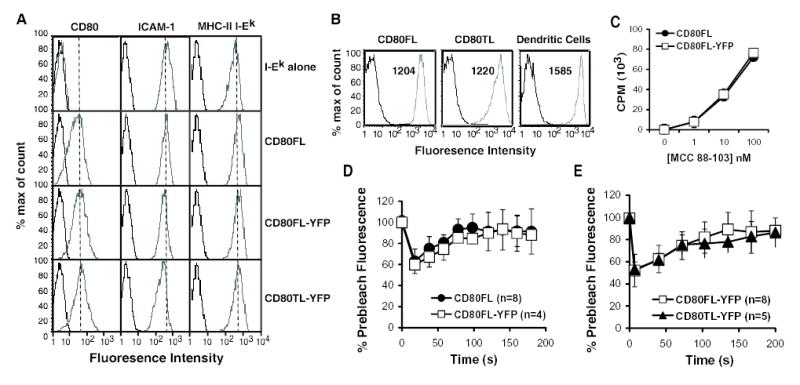
(A) FACS analysis of surface expression of CHO APCs. CHO cells lines: I-Ek-CHO, CD80FL-CHO, CD80FL-YFP-CHO and CD80TL-YFP-CHO were sorted to equivalent levels of expression for I-Ek, hamster ICAM-1 and variants of CD80. Anti-CD80, antihamster ICAM-1 and anti-I-Ek (grey line), control (black line). (B) CD80 expression level on CHO transfected cell lines and LPS activated CD11c+ DCs are equivalent. The number in the top of the FACS plot indicates the mean fluorescence intensity of CD80 staining. Spleenic DCs were purified using CD11c beads and stimulated overnight with 10 μg / ml of LPS and 1 μg / ml of anti-CD40 antibody. The DC populations displayed were gated on CD11c high cells. (C) The fusion of YFP to CD80 did not alter the ability of CD80 to co-stimulate T cell proliferative response. CHO transfectants of CD80FLCHO (solid circle) and CD80FL-YFP-CHO (open square). [3H] thymidine was added at 48 hr for 16 hr before harvesting. Error bars represent standard deviations from triplicate data sets. Data are representative of two independent experiments. (D) Fluorescence recovery after photobleaching at 24°C of CD80 versus CD80FL-YFP membrane mobility. CD80FL (solid circle) and CD80FL-YFP (open square). (E) Fluorescence recovery after photobleaching at 37°C of CD80FL-YFP (open circle) versus CD80TLYFP (solid triangle) membrane mobility. Number of cells = n. Data are representative of two independent experiments.