
FIGURE 3. CD80-CD28 engagement facilitated TCR accumulation in the cSMAC.
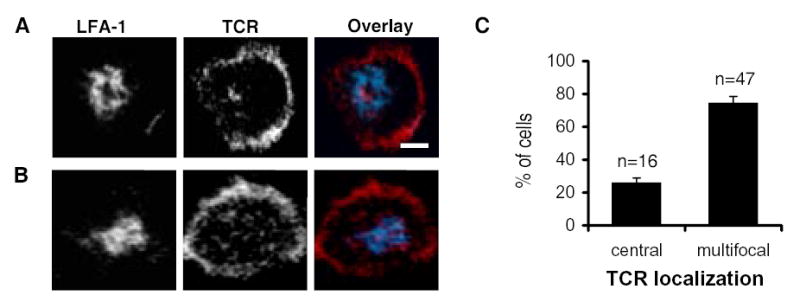
IS of I-Ek-CHO and naïve 5C.C7 T cells. The stable synapses exhibited both a central (A) and multifocal (B) TCR accumulation patterns in the IS. The color overlay images showed LFA-1 in blue and TCR in red. Images are 3-D reconstruction rotated in an en face view with T cell on top of the CHO cell. The white bar indicates a distance of 2 μm. (C) Quantitation of TCR localization in the absence of CD80. Counts were taken during a 30 min time frame of I-Ek-CHO and T cell interactions. The percentages of the cells observed with each pattern were the calculated mean of 3 independent experiments with a total of 63 cells. The error bar indicates the standard error mean.