
Fig. 6.
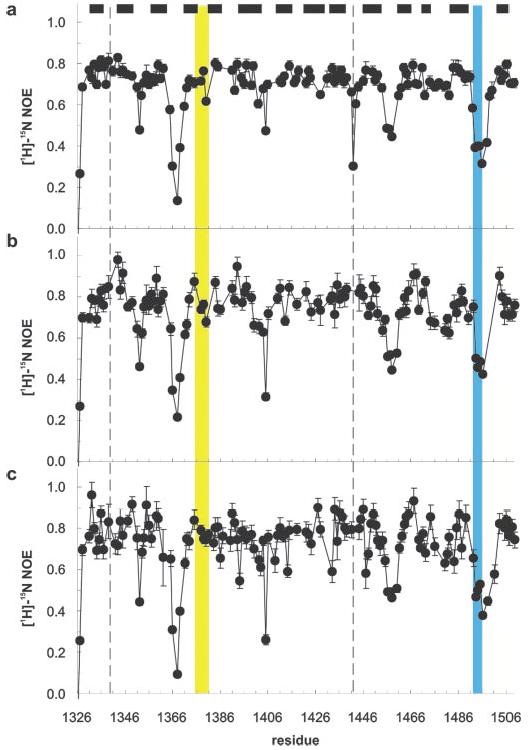
Backbone dynamics of FIII9′10 variants. Shown is a plot of [1H]15N NOE for FIII9′10 (a), FIII9′10-CCred (b), and FIII9′10-CCox (c). The filled bars denote the location of β-strands, and the dotted lines mark the sites of the mutated residues Ala1340 and Val1442. The synergistic PHSRN sequence and the RGD motif are highlighted in yellow and blue, respectively.