
Figure 4. Distribution of African-American and White Patients, by the Average Percentage of African-American AMI Patients Admitted to the Hospital.
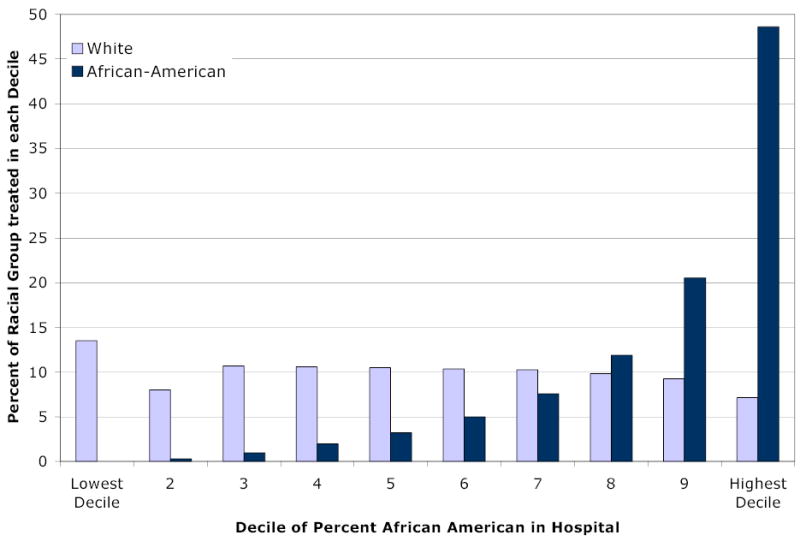
Legend: The graph reports the share of each racial group (relative to all African-American or white AMI patients in the Medicare fee-for-service population) treated in hospitals within each decile category. A joint test of the importance of hospitals deciles is significant at the p < .001 level.