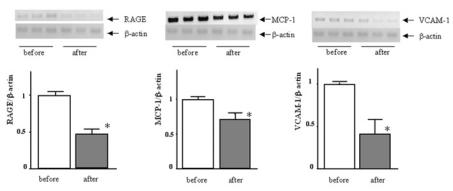
Figure 2.
Effects of patient serum on atherosclerosis–related gene expression in HUVECs. HUVECs were treated with patient serum before or after AST–120 treatment for 12 h, and RAGE, VCAM, and MCP–1 mRNA levels were determined. Upper panel shows representative RT–PCR bands of these genes. Each lower panel shows the quantitative representation of each gene induction. Data were normalized by the intensity of β–actin mRNA–derived signals and related to the value of the control. *P < 0.05 compared with the value before AST–120 treatment.

