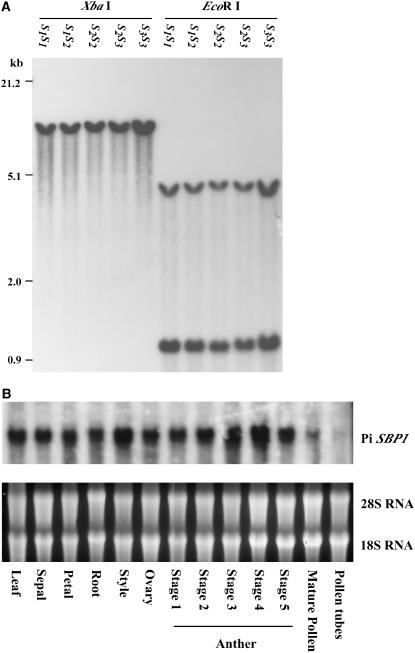
Figure 3.
Genomic Hybridization and Expression Pattern of Pi SBP1.
(A) DNA gel blot analysis. Genomic DNA (15 μg) isolated from each S-genotype indicated was digested with EcoRI or XbaI, and the blot was hybridized with the full-length Pi SBP1 cDNA.
(B) RNA gel blot analysis. Each lane contained 20 μg of total RNA isolated from the tissue indicated, and the blot was hybridized with the full-length Pi SBP1 cDNA. The anther stages are defined by flower-bud size as described previously (Lee et al., 1996). Ethidium bromide staining of the gel used in blotting shows equal loading of the RNA samples.

