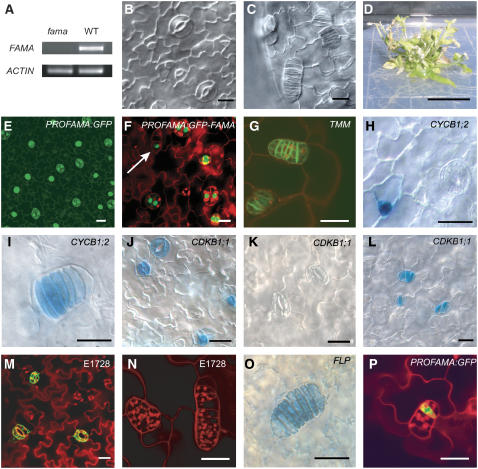
Figure 2.
FAMA Expression Pattern and Loss-of-Function Phenotypes.
(A) RT-PCR of FAMA from fama-1 allele and Col control.
(B) and (C) Differential interference contrast (DIC) images of wild-type and fama-1 cotyledon epidermis 7 d after germination (DAG).
(D) Two-month-old fama-1 plant. Bar = 1 cm.
(E) and (F) Expression of PROFAMA:GFP and PROFAMA:GFP-FAMA, respectively, in Col cotyledon epidermis. Arrow in (F) points to earliest expression in GMCs.
(G) to (P) Expression of cell fate and cell division markers in fama-1. Bar = 10 μm.
(G) PROTMM:TMM-GFP.
(H) and (I) CYCB1;2:GUS in Col and fama-1, respectively.
(J) to (L) CDKB1;1:GUS in Col at 5 DAG (J) and 10-DAG (K) and fama-1 at 10 DAG (L). Note the prolonged expression of this marker in fama-1.
(M) and (N) Mature stomata marker E1728:GFP in Col and fama-1, respectively.
(O) PROFLP:GUS/GFP in fama-1.
(P) PROFAMA:GFP in fama-1.

