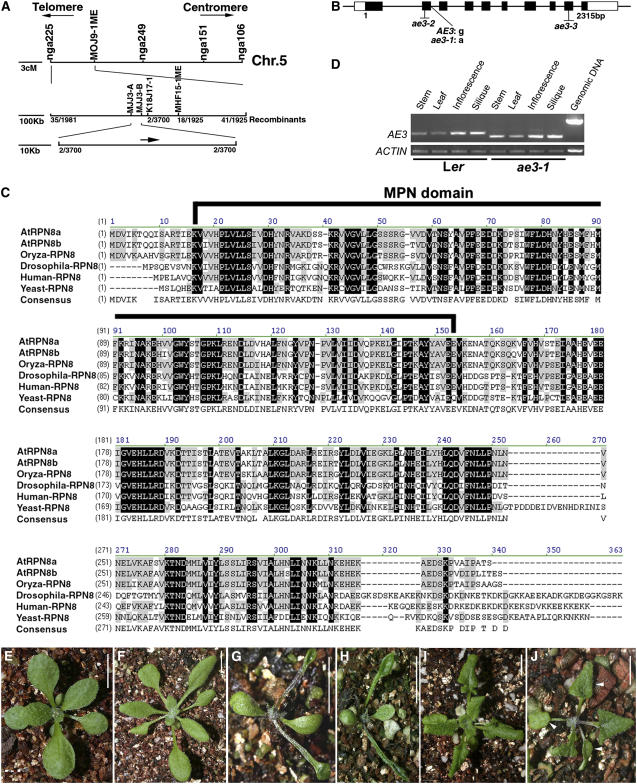
Figure 7.
Molecular Identification of AE3.
(A) Fine structure mapping to localize the AE3 gene on chromosome 5 between markers MJJ3A and MJJ3B.
(B) Structure of the AE3 gene. Black and white boxes indicate the protein coding regions and untranslated regions (UTRs), respectively.
(C) Alignment of the deduced amino acid sequence of AE3 with selected homologous proteins. Residues that are highlighted in black show identity, and conserved residues are highlighted in gray. The MPN domain was indicated by a black line.
(D) Expression pattern of AE3. Note that the PCR products in ae3-1 are smaller in size than those in the wild type due to improper intron splicing.
(E) A T1 transgenic plant carrying a 5-kb complementation fragment is wild-type-like.
(F) An ae3-2 seedling (Col).
(G) An ae3-2 as2-101 double mutant plant.
(H) An ae3-3 as2-101 double mutant plant. Note that the ae3-2 as2-101 and ae3-3 as2-101 phenotypes are very similar to those of ae3-1 as2-101.
(I) An as2-1 seedling (Col).
(J) An ae3-2 as2-1 double mutant seedling showing lotus leaves (arrowheads), which are not observed in the as2-1 single mutant.
Bars = 1 cm in (E) to (J).

