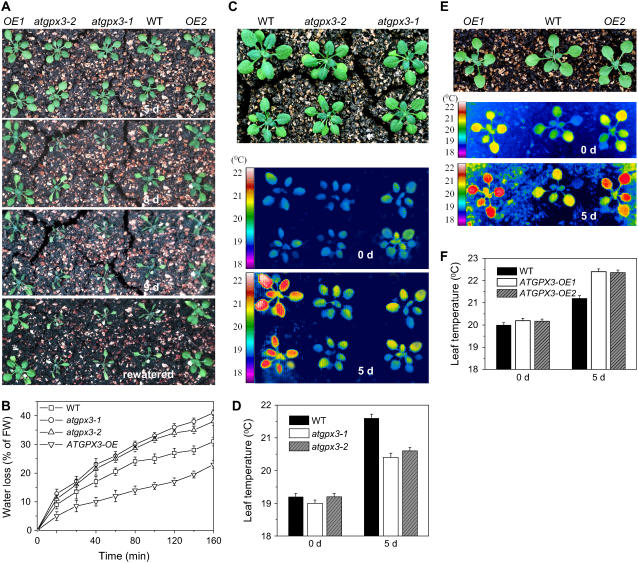
Figure 4.
Responses of atgpx3 Mutants and Overexpression Lines to Drought Stress.
(A) Analysis of the drought stress sensitivity of Arabidopsis seedlings. Seven-day-old Arabidopsis seedlings were transferred to soil and grown for 10 d in a growth chamber, after which watering was stopped for the drought stress treatment. The photographs were taken (from top to bottom) 5, 8, and 9 d later and again 1 d after being rewatered. OE, overexpression.
(B) Transpirational water loss in wild-type, atgpx3, and overexpression lines at the indicated time points after detachment. Water loss is expressed as the percentage of initial fresh weight (FW). Values are means ± sd of four samples (each sample had six leaves).
(C) False-color infrared images of drought-stressed plantlets. The thermal images show leaf temperature profiles of 14-d-old wild-type, atgpx3-1, and atgpx3-2 plantlets at the start of drought treatment (middle panel) and 5 d later (bottom panel). The top panel shows the 5-d drought-stressed plants.
(D) Temperature of the leaf surface in ATGPX3 mutants quantified by infrared thermal imaging. Data are means ± sd (n = 20 plants for each condition; data are from ∼4000 measurements of square pixels from multiple leaves of each plant).
(E) False-color infrared images of drought-stressed wild-type and ATGPX3 transgenic plants. The same experimental procedures were used as described for (C). The middle and bottom panels show leaf temperature profiles at the start of drought treatment (middle panel) and 5 d later (bottom panel). The top panel shows the 5-d drought-stressed plants.
(F) Temperature of the leaf surface in ATGPX3 transgenic plants quantified by infrared thermal imaging upon drought for 5 d. Data are means ± sd (n = 20 plants for each condition; values are from ∼4000 measurements of square pixels from multiple leaves of each plant in three independent experiments).

