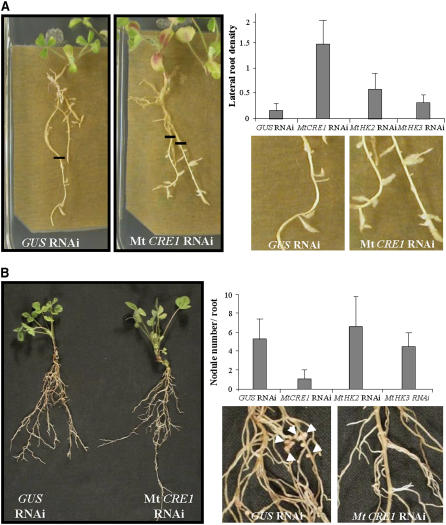
Figure 3.
Mt CRE1 RNAi Roots Are Affected in Lateral Root and Nodule Development.
(A) Representative examples of root growth observed in A. rhizogenes–transformed M. truncatula roots expressing GUS RNAi (left panel and close-up) and Mt CRE1 RNAi (right panel and close-up) constructs 6 d after transfer to LRIM. Black lines indicate the position of root tips at the moment of transfer. Lateral root density is calculated in A. rhizogenes–transformed M. truncatula roots in the newly grown root region 6 d after transfer to LRIM. Histograms represent lateral root densities in one (n > 25) out of three biological experiments for GUS RNAi, Mt CRE1 RNAi, Mt HK2 RNAi, and Mt HK3 RNAi roots. Error bars indicate standard deviations (ANOVA, P < 0.001).
(B) One-month-old transgenic roots expressing GUS RNAi or Mt CRE1 RNAi constructs were S. meliloti–inoculated in a greenhouse. General view of GUS RNAi and Mt CRE1 RNAi composite plants (left panel) and close-up of S. meliloti–inoculated GUS RNAi (close-up, left panel) and Mt CRE1 RNAi (close-up, right panel) roots. Arrowheads indicate nodule locations. Quantification of nodules was done on GUS RNAi, Mt CRE1 RNAi, Mt HK2 RNAi, and Mt HK3 RNAi roots 15 DAI with S. meliloti 2011 strain. Histogram represents nodule numbers per transgenic root in one out of five biological experiments (n > 25). Error bars represent standard deviations (ANOVA, P < 0.001).

