Figure 4.
Early Nodulation Is Perturbed in Mt CRE1 RNAi Roots.
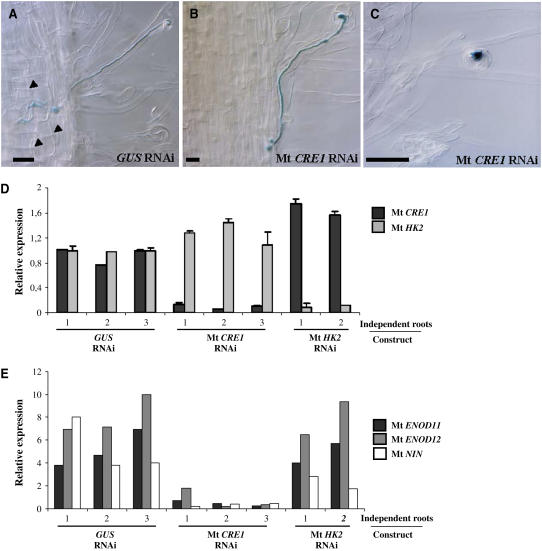
(A) to (C) Histochemical staining of an S. meliloti strain expressing a ProHemA:LACZ reporter construct to follow early events of nodulation. Representative infection threads observed in an S. meliloti–inoculated GUS RNAi root (A) and nodule-deficient Mt CRE1 RNAi roots ([B] and [C]) are shown. Arrowheads indicate cortical cell divisions. Note the lack of cortical cell divisions in Mt CRE1 RNAi roots. Bars = 25 μm.
(D) Real-time RT-PCR analysis of Mt CRE1 and Mt HK2 expression in representative independent transgenic roots expressing GUS RNAi, Mt CRE1 RNAi, or Mt HK2 RNAi constructs 15 DAI by S. meliloti. Histograms represent the quantification of each specific PCR amplification product normalized to the constitutive control Mt ACTIN11. The value of control transgenic roots (i.e., GUS RNAi) is set to 1 as reference. Error bars represent standard deviation for three technical replicates.
(E) Expression analysis of the early nodulation markers Mt ENOD11, Mt ENOD12, and Mt NIN by semiquantitative RT-PCR in independent transgenic roots expressing GUS RNAi, Mt CRE1 RNAi, or Mt HK2 RNAi constructs 15 DAI by S. meliloti. Histogram represents the quantification of each specific PCR amplification product normalized to the constitutive control Mt ACTIN11.

