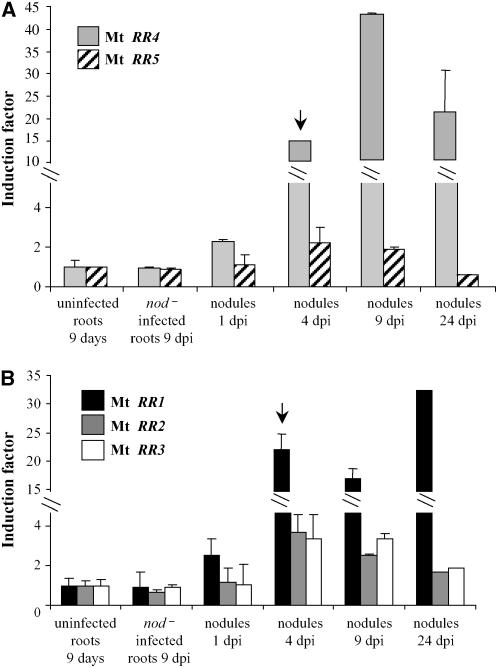
Figure 5.
Differential Expression of Cytokinin-Related Response Regulator Genes during Nodule Formation.
Real-time RT-PCR analysis of roots or nodules at different days after S. meliloti infection (dpi). Expression analysis of A-type (A) and B-type (B) response regulator genes. Histograms represent the quantification of specific PCR amplification products normalized to the constitutive control Mt EF1α. The value for uninfected control roots is set to 1 as reference. A representative example out of three biological experiments is shown, and error bars represent standard deviation for three technical replicates. Arrows indicate significant induction of specific genes mentioned in the text.

