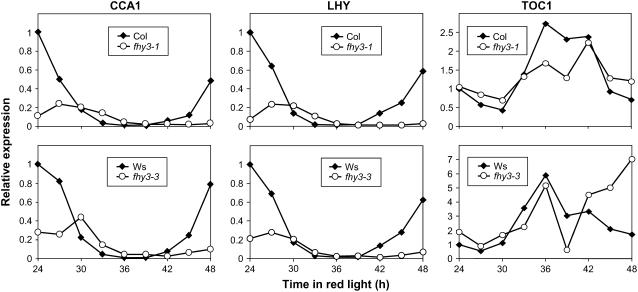
Figure 5.
Expression Patterns of CCA1, LHY, and TOC1 in Constant Red Light.
Wild-type and fhy3 seedlings were entrained in LD(12:12) for 6 d before transfer to Rc. After 24 h in red light, individual batches of seedlings were harvested at 3-h intervals for a further 24 h. Expression of CCA1 (left), LHY (middle), and TOC1 (right), relative to the wild type at time 0, was measured using quantitative PCR.

