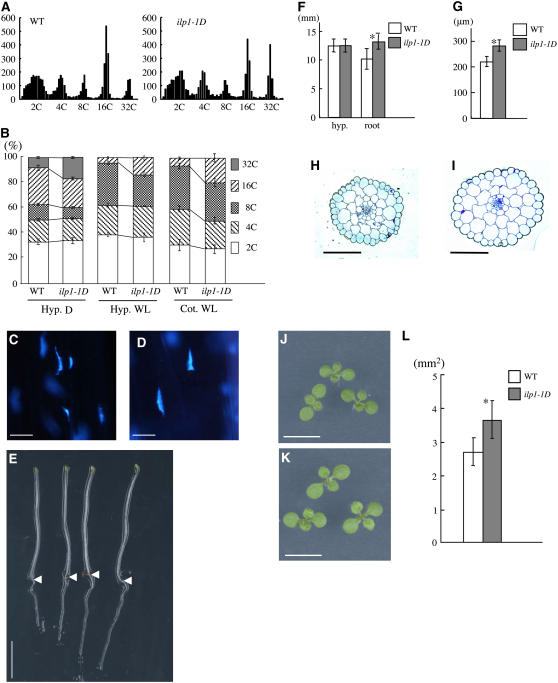
Figure 2.
Ploidy Levels Were Highly Increased in Dark- and Light-Grown ilp1-1D Seedlings.
(A) Histograms of ploidy levels of hypocotyl cells of 7-d-old dark-grown seedlings. Left panel, wild type; right panel, homozygous ilp1-1D; x axis, nuclear ploidy; y axis, cell count. Approximately 5000 nuclei were counted in the wild type and ilp1-1D.
(B) Relative ratio of each cell ploidy of dark- and light-grown wild type and ilp1-1D. At least 20 seedlings were used for ploidy analysis, and it was replicated three times. Hyp. D, hypocotyl cells of dark-grown seedlings; Hyp. WL, hypocotyl cells of light-grown seedlings; Cot. WL, cotyledon cells of light-grown seedlings. Approximately 3000 to 5000 nuclei were counted in the wild type and ilp1-1D.
(C) and (D) DAPI staining of nuclei of the lower part of the hypocotyl of the wild type (C) and ilp1-1D (D).
(E) Morphology of 7-d-old dark-grown seedlings of the wild type (two left seedlings) and ilp1-1D (two right seedlings). Arrowheads indicate the junction of hypocotyl and root.
(F) Hypocotyl and root length of 7-d-old dark-grown wild-type and ilp1-1D seedlings.
(G) Diameter of hypocotyls of 7-d-old dark-grown wild-type and ilp1-1D seedlings.
(H) and (I) Transverse sections of dark-grown hypocotyls of the wild type (H) and ilp1-1D (I).
(J) and (K) Cotyledons of 7-d-old light-grown seedlings of the wild type (J) and ilp1-1D (K).
(L) Cotyledonal areas of 7-d-old light-grown wild-type and ilp1-1D seedlings.
At least 20 seedlings were measured in (F), (G), and (L). Bars in (B), (F), (G), and (L) indicate standard deviation. Bars = 10 μm in (C) and (D), 5 mm in (E), (J), and (K), and 100 μm in (H) and (I). Student's t test: * 0.001 > P versus the wild type in (F), (G), and (L).

