Figure 3.
Cloning and Characterization of the ILP1 Gene.
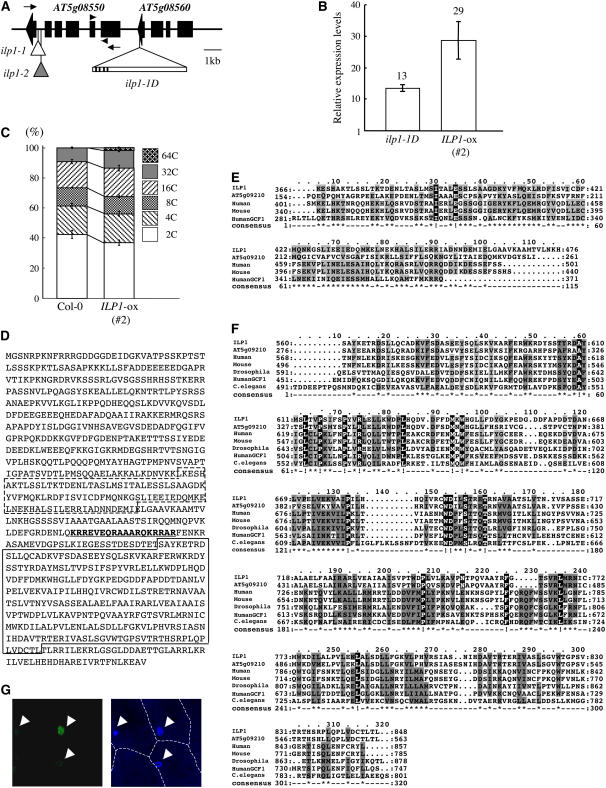
(A) T-DNA insertion sites in ilp1-1D. The triangle with bar indicates the activation-tagging T-DNA insertion site in ilp1-1D. Black lines on bar indicate the four copies of the CaMV 35S enhancer near the right border. Small white and gray triangles indicate the T-DNA insertion sites of ilp1-1 (SALK_030650) and ilp1-2 (SALK_135563), respectively. Arrowheads indicate primer positions for real-time PCR in Figures 3B and 6C and Supplemental Figure 2B online, and arrows indicate primer positions for semiquantitative RT-PCR in Figure 4B.
(B) Real-time PCR analysis showing expression of AT5g08550 (ILP1) in the wild type (Col-0), ilp1-1D, and ILP1-ox. Relative expression levels: expression levels of the ILP1 genes in ilp1-1D and AT5g08550 (ILP1) overexpressing line (#2) (ILP1-ox) relative to the wild type. Error bars indicate standard deviation.
(C) Relative ratio of each cell ploidy of dark-grown wild type (Col-0) and ILP1-ox (#2). Approximately 5000 nuclei were counted in the wild type and ILP1-ox.
(D) Amino acid sequence of ILP1 protein. Box with dashed line indicates motif 1, and box with solid line indicates motif 2. Underlined bold letters indicate putative NLS.
(E) Alignment of ILP1 motif 1 and its homologs. The ILP1 motif 1 was aligned with similar regions of other proteins: Arabidopsis, human, mouse, and human GCF1. The amino acid identity and similarity between the ILP1 motif 1 and its homologs are 38 and 42% for Arabidopsis, 27 and 48% for human, 27 and 48% for mouse, and 28 and 52% for human GCF1.
(F) Alignment of ILP1 motif 2 and its homologs. Motif 2 was aligned with similar regions of other proteins; Arabidopsis, human, mouse, Drosophila, human GCF1, and C. elegans. All alignments were performed using ClustalW and Mac Boxshade software. The amino acid identity and similarity between ILP1 motif 2 and its homologs are 72 and 77% for Arabidopsis, 27 and 45% for human, 27 and 44% for mouse, 28 and 48% for Drosophila, 22 and 43% for human GCF1, and 25 and 44% for C. elegans.
For (E) and (F), gray letters indicate functionally conserved amino acid residues in at least three members. White letters with black background indicate conserved amino acid residues in all members.
(G) Localization of ILP1:GFP. Left panel indicates fluorescence of ILP1:GFP. Right panel is a DAPI-stained nuclear image. Arrowheads indicate nuclei. The experiment was repeated three times.

