Figure 4.
Loss of ILP1 Function Decreases Polyploidy Levels.
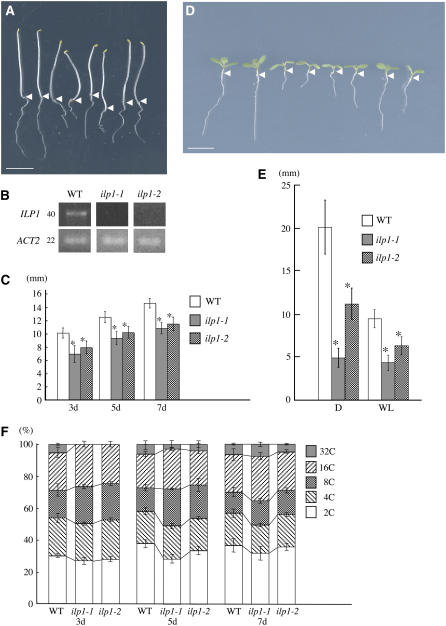
(A) Morphology of dark-grown wild type, ilp1-1, and ilp1-2. Seedlings were grown for 5 d. Each pair of seedlings from left to right is wild type, ilp1-1, heterozygotes of ilp1-1 and ilp1-2, and ilp1-2, respectively. Isogenic wild-type siblings of ilp1-1 were used as the wild type. The same result was obtained from wild-type siblings of ilp1-2. Arrowheads indicate the junction of hypocotyl and root.
(B) Semiquantitative RT-PCR for the expression of ILP1. Number on the left indicates cycles of PCR. ACT2 was used as a control.
(C) Hypocotyl length of 3-, 5-, and 7-d-old dark-grown wild-type, ilp1-1, and ilp1-2 seedlings.
(D) Seven-day-old light-grown seedlings of the wild type, ilp1-1, and ilp1-2. Alignment of seedlings is same as in (A). Arrowheads indicate the junction of hypocotyl and root.
(E) Root length of 7-d-old dark- and light-grown wild type, ilp1-1, and ilp1-2. D, darkness; WL, white light.
(F) Relative ratio of each cell ploidy of 3-, 5-, and 7-d-old dark-grown wild-type, ilp1-1, and ilp1-2 homozygotes. Approximately 3000 nuclei were counted in the wild type, ilp1-1, and ilp1-2.
Bars in (A) and (D) = 5 mm. Error bars in (C), (E), and (F) indicate standard deviation. Student's t test: * 0.001 > P versus the wild type in (C) and (E). At least 20 seedlings were measured in (C) and (E).

