Figure 6.
ILP1 Represses CYCA2 Expression in Arabidopsis.
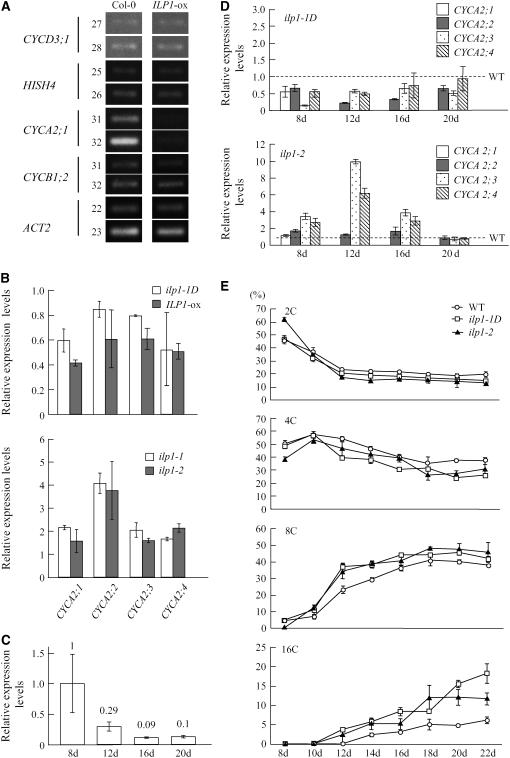
(A) Semiquantitative RT-PCR analysis of cell cycle–specific genes. CYCD3;1, HISH4, CYCA2;1, and CYCB1;2 are G1-, S-, G2-, and M-phase-specific markers, respectively. ACT2 was used as a control. Numbers on left side indicate cycles of PCR.
(B) Real-time PCR analysis of CYCA2 gene family members. Expression levels of the CYCA2 family genes were normalized with ACT2 expression. Relative expression levels: expression levels of the CYCA2 genes in each mutant line and an ILP1-ox line relative to the wild type. RNA was isolated from 7-d-old dark-grown hypocotyls of ilp1-1D and ILP1-ox (top panel) and from 3-d-old dark-grown hypocotyls of ilp1-1 and ilp1-2 (bottom panel). The experiment was repeated four times.
(C) Real-time PCR analysis of ILP1 in the wild type (Col-0). The numbers indicate ILP1 expression relative to day 8. The experiment was repeated four times.
(D) Real-time PCR analysis of CYCA2 gene family members in first leaves of ilp1-1D and ilp1-2 at four developmental stages. Expression levels of the CYCA2 family genes were normalized with ACT2 expression. Relative expression levels: expression levels of the CYCA2 genes in each mutant line relative to the wild type. CYCA2;1 expression was not detected in the wild type and ilp1-1D after day 12. The experiment was repeated four times.
(E) Ploidy distribution patterns of first leaves of the wild type, ilp1-1D, and ilp1-2 at several developmental stages. The fraction of each ploidy was plotted as wild type (open circle), ilp1-1D (open square), and ilp1-2 (closed triangle). Isogenic wild-type siblings of ilp1-1D were used as the wild type. The same result was obtained from wild-type siblings of ilp1-2. The experiment was repeated three times.
Error bars in (B) to (E) indicate standard deviation.

