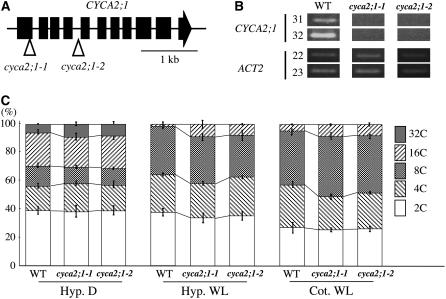
Figure 8.
Loss of CYCA2;1 Reduced Polyploidy Level.
(A) Loci of T-DNA insertions in CYCA2;1. Triangles indicate insertion sites of T-DNAs of cyca2;1-1 (SALK_121077) and cyca2;1-2 (SALK_136750).
(B) Semiquantitative RT-PCR analysis of CYCA2;1. Numbers on left side indicate cycles of PCR.
(C) Relative ratio of each cell ploidy of dark- and light-grown wild-type, cyca2;1-1, and cyca2;1-2 homozygotes. Hyp. D, hypocotyl cells of dark-grown seedlings; Hyp. WL, hypocotyl cells of light-grown seedlings; Cot. WL, cotyledon cells of dark-grown seedlings. Isogenic wild-type siblings of cyca2;1-1 were used as the wild type. The same result was obtained from wild-type siblings of cyca2;1-2. Approximatley 3000 nuclei were counted in the wild type, cyca2;1-1, and cyca2;1-2. Error bars indicate standard deviation.

