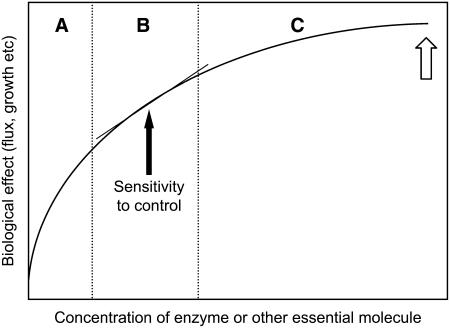
Figure 3.
Typical Dose–Response Curve of the Concentration of Necessary Molecules against Response.
The graph indicates the variation in response against concentration either of an enzyme or other essential molecule to the output of a metabolic pathway or a complex system process, such as growth or development. With increasing concentration, the curve results from increasing constraints by other linked molecules. Region A is typically occupied by systems in which mutation or inhibition has been used to lower the amount of the essential molecule. Region B is more typical of molecules whose amount influences the control characteristics of the system. Region C is typical of many essential molecules that have little direct influence on the control behavior of the system but by mutation or inhibition can be moved into region A. The sensitivity to control is the tangent to the curve and is indicated only for region B. The sensitivity is much higher or lower in regions A and C, respectively. The open arrow marks the typical position of an enzyme in a metabolic pathway.

